

The Large Google Maps Collider
Google maps, the most ubiquitous mapping software, now with its own above ground Large Hadron Collider.
Introduction
Google Maps, everybody knows it, most people look at it daily. I am certainly one of those people. And often the overhead map view that comes across my smartphone's screen is my place of work, CERN (Conseil Européen pour la Recherche Nucléaire), home of the Large Hadron Collider (LHC). A massive high energy particle accelerator located on the franco-swiss border just outside of Geneva, Switzerland. Spanning 27 km in circumference with four multi story particle detectors at its collision points it would be an unmissable sight ...were it not 100 meters underground. Well I always thought that it was unfortunate that people couldn't get a handle on it's scale with out having to go for a visit underground. And what better way to capture that scale then with the intuition and familiarity built up over countless hours spent staring at Google Maps? So I set out to do this. For fun. For education. For whatever. And before we get started I'll just link the fully formed component on gihub here here and its implementation here.
Setting Up The Google Maps API
So this seemed like a simple enough task, "Draw a big circle on a map." To do this Google makes it relatively easy with the Google Maps API, and you can actually choose a couple of languages to use the API, which is nice. And there is really good documentation as well. Good job Google. So first you will have too get an API key, which is fairly straight forward and you can follow Google's direction here. You should have a year of free service from google. I'll be using js react as this is native way of doing things with the gatsby site generator framework in which this site is built on. Now javascript is the native way of interacting with the API so we will need a wrapper to be able to do things in js react. The one I'll be using in this post is here: google-maps-react, which you will need to install if you are going to do things my way.
npm install --save react-google-maps # or
yarn add react-google-maps
should be sufficient.
Drawing the Big Circle
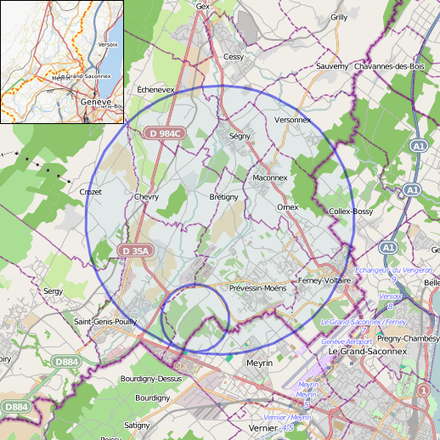
So this first part is pretty simple. Google has some predefined functions that allow you to draw geometric shapes. For the circle we simply need the coordinates for the center and a radius. While the circumference (and therefore radius) is public info, the exact coordinates of each experiment, that would help me nail down the center, isn't something that is so readily available. So this took a bit of iteration of just staring at google maps as well as some input of my own personal knowledge of where the actual ATLAS and CMS devices sit in their respective sites (only the vague general sites are visible on google maps). So while my big circle probably doesn't exactly match up with the actual beam pipe everywhere I think we do get pretty darn close. But anyway here is the center and radius that I found to work well, (latitude, longitude) = (46.224690, 6.110898), radius = 4249.43698 meters. So our circle looks like this :
defaultCenter={{ lat: 46.224690, lng: 6.110898 }}
>
<Circle
  center = {{ lat: 46.272948, lng: 6.064695 }}
  radius = {4249.43698}
  options = {{
   fillOpacity: 0.0,
   strokeColor: '#0b80c3',
   strokeWeight: 2,
    }}
/>

And here is what should be a working component module:

```javascript
import React from 'react';
import { InfoWindow, MarkerWithLabel, withScriptjs, withGoogleMap, GoogleMap, Marker, Circle, Polyline, DrawingManager} from 'react-google-maps';
class Map extends React.Component {
  //state = {}
  //pathFunc = () => {}
  //pathFunc2 = () => {}
  //componentDidMount = () => {
  //  this.interval = window.setInterval(this.moveObject, 50)
  //}
  //componentWillUnmount = () => {
  //  window.clearInterval(this.interval)
  //}
  //moveObject = () => {}
  render = () => {
    return (
      <GoogleMap
        defaultZoom={13}
        defaultCenter={{ lat: 46.224690, lng: 6.110898 }}
        >
        <Circle
          center = {{ lat: 46.272948, lng: 6.064695 }}
          radius = {4249.43698}
          options = {{
           fillOpacity: 0.0,
           strokeColor: '#0b80c3',
           strokeWeight: 2,
            }}
        />
      </GoogleMap>
  }
}

const MapComponent = withScriptjs(withGoogleMap(Map))

export default () => (
  <MapComponent
  googleMapURL='https://maps.googleapis.com/maps/api/js?key=YOUR_API_KEY&libraries=geometry,drawing,places'
  isMarkerShown
  loadingElement={<div style={{ height: `100%` }} />}
  containerElement={ <div style={{ height: '450px', width: '100%' }} /> }
  mapElement={<div style={{ height: `100%` }} />}
  />
)
Alright so now that we have our cool big circle drawn we will try to do something a bit more ambitious. We are going to see if we can get some particles circulating along the circle!
Achieving Stable Beams
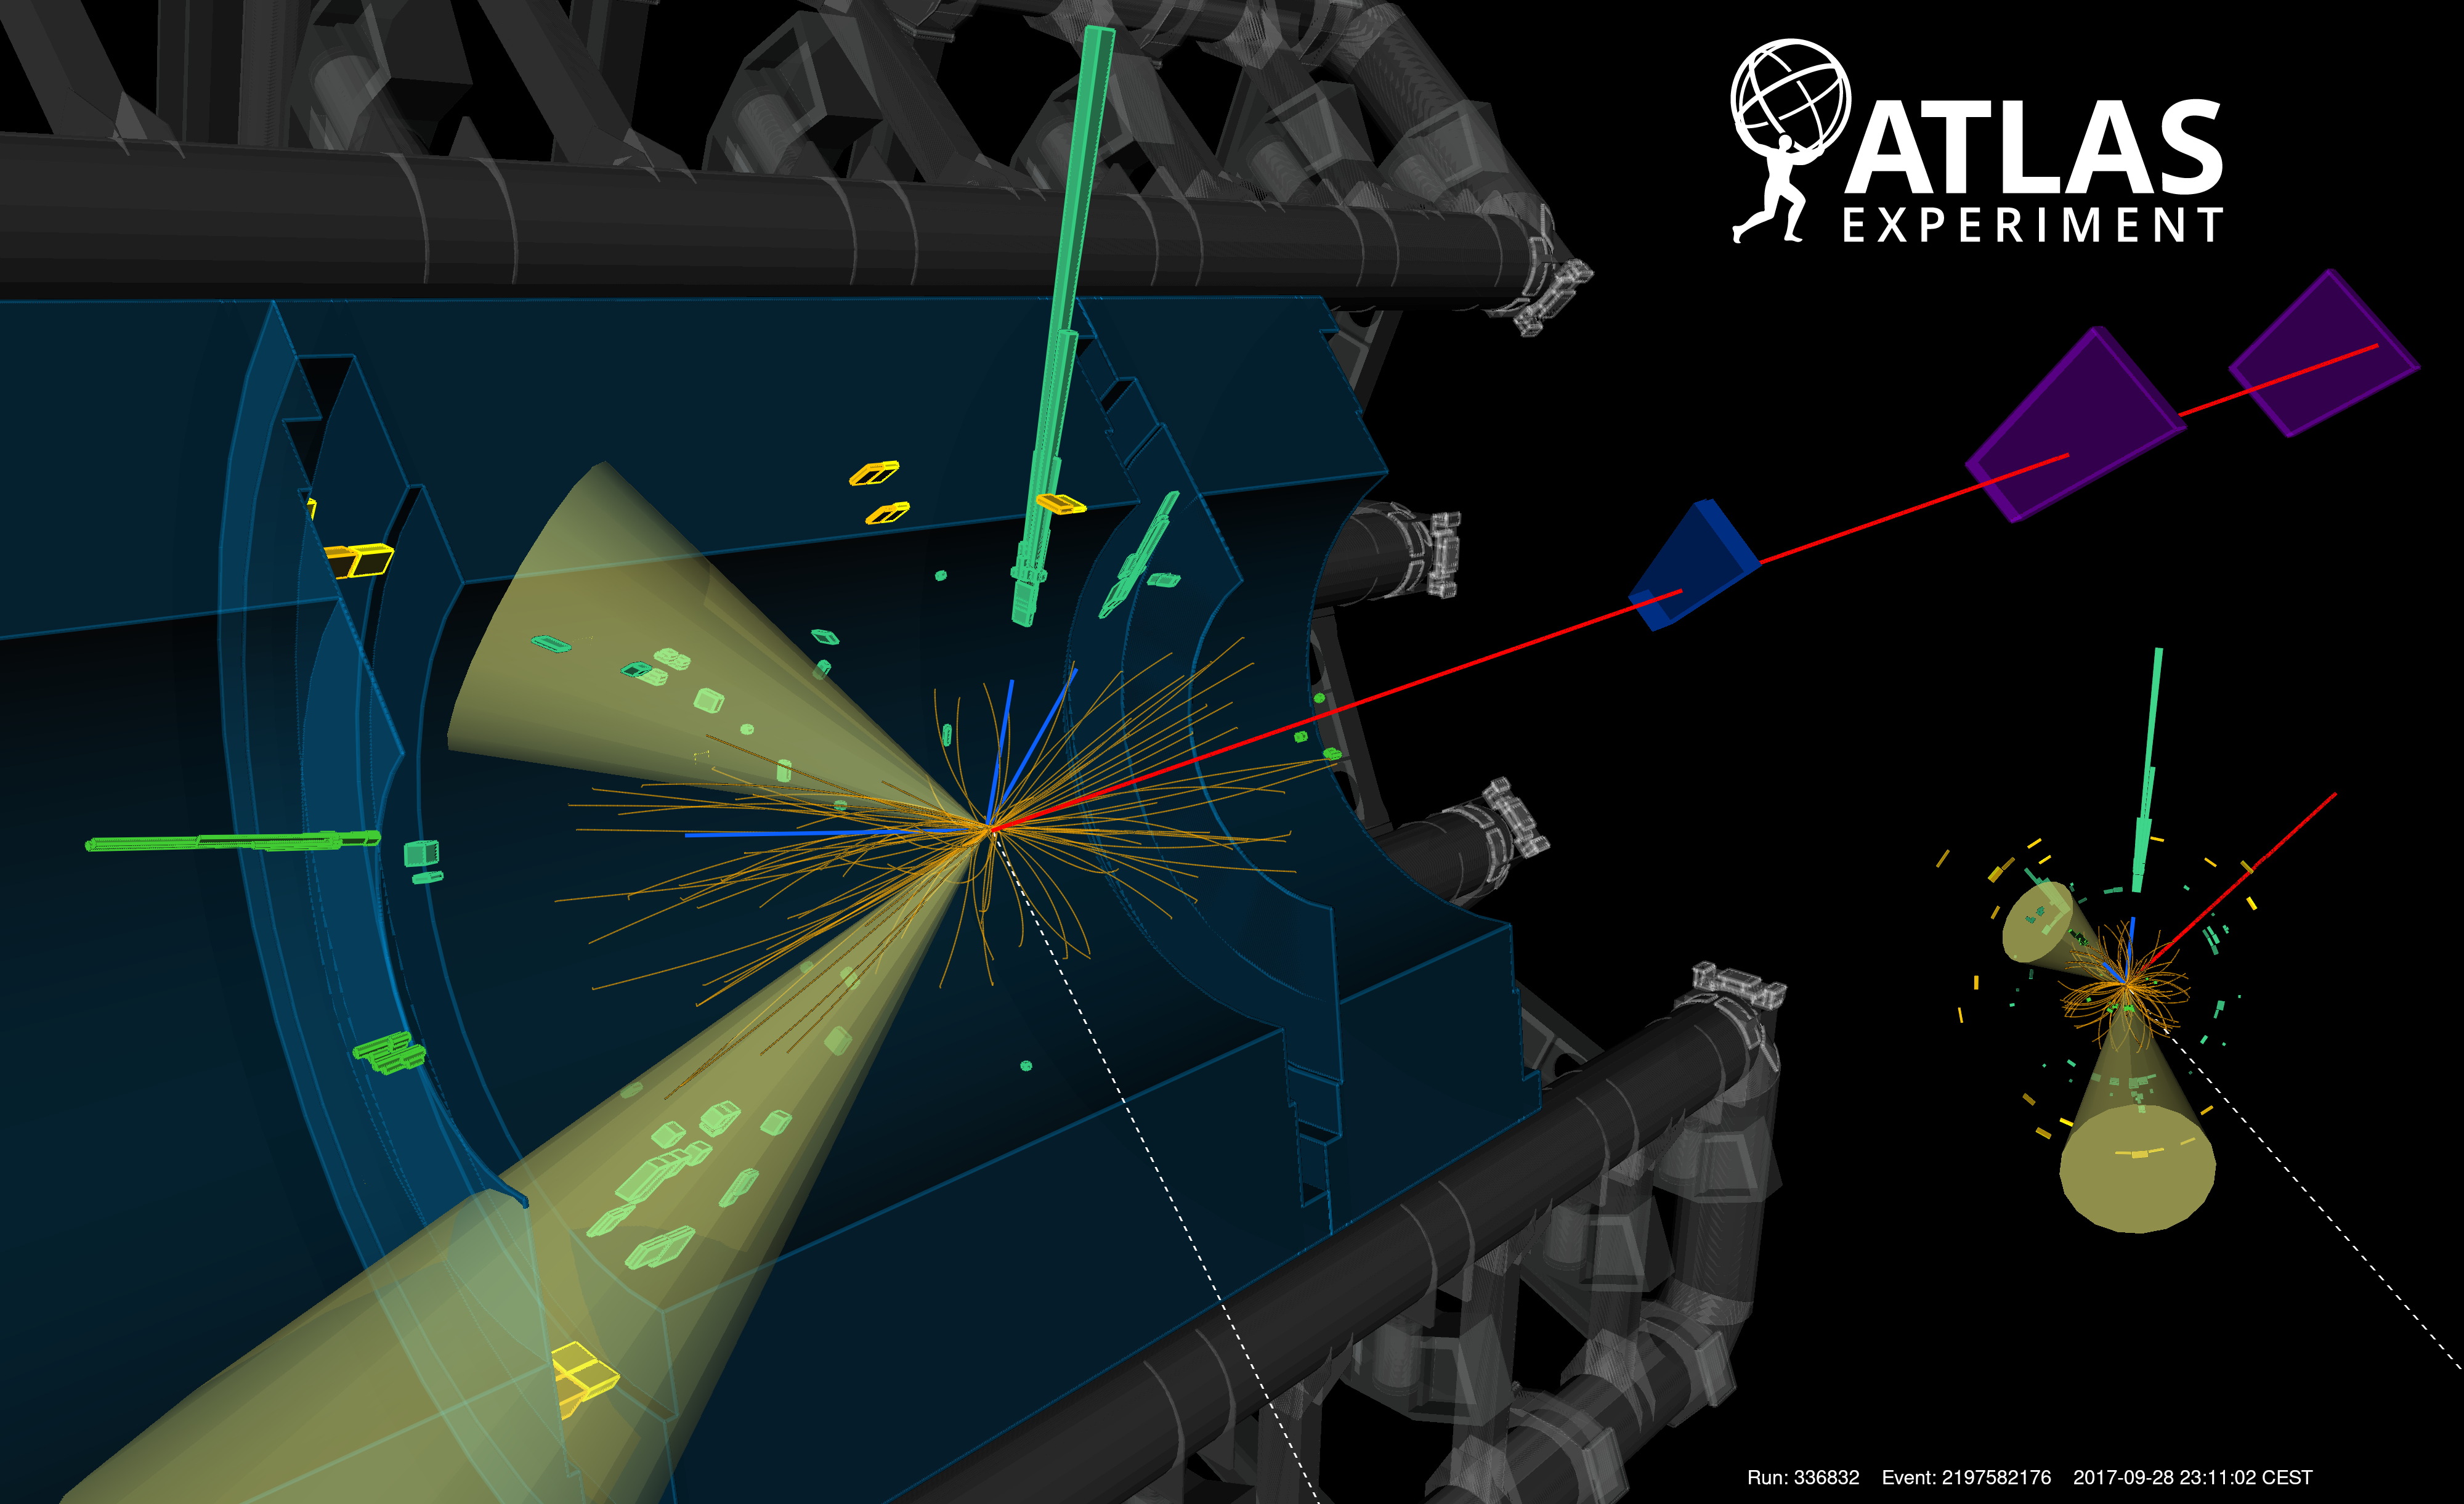
So as you very well may know, or not, what we do at the LHC is accelerate two oppositely circulating 'beams' of protons (and sometimes heavy Ions) at near light speeds.
Then the idea is collide these beams and reconstruct all the particles that come out of these proton-proton collisions and try to tease out any new particles that may have been created (or make really precise measurements of known particles.)
So first things first, lets see if we can get some protons circulating.
Firstly we will need to introduce a state method that will update at every step such that we have
  state = {
    progress: [],
    progress2: [],
  }
Where progress1 will be protons circulating clockwise and progress2 are protons circulating counter-clockwise.
Next we want to define a function that upon an update of the progress state the particle iterates one step along a circular path on the map, effectively creating our animation.
For this it was simple enough to generate a large list of positions and then iterate though them later in the code.
For this we have to do a little math and remember (google) our coordinate transformations from polar to Cartesian, as it is easiest to just step in polar (some ) and then convert this to our longitude and latitude 'Cartesian' coordinates.
Cartesian in single quotes there as technically we are on a sphere (the Earth) along with the added complication that long/lat only act as a Cartesian coordinates well near the equator. .
And while the LHC is a big boi it isn't that big and so we can treat this as being in the local regime of a smooth manifold (a circle on a flat boi instead of a curvy boi).
Writing down these familiar equations we have:
Where is the radius of the LHC and / are the long/lat for the LHC all stated previously and is the step that will effectively determine the frame rate of our animation.
It is then also convenient at this point to define a shift in such that both beams start at the location of the ATLAS detector, in this way we have them already colliding at one of the collision points, this ends up just being ~ (how nice) .
And as luck would have it the CMS detector (almost as if by design) is directly opposite the ATLAS detector on the circle, so as long as our beams are travelling at the same speed we should get colliding beams at the two main multi-purpose detectors right off the bat!
And now the last bit too add has to do with what I had mentioned earlier about lat/long only acting Cartesian at the equator.
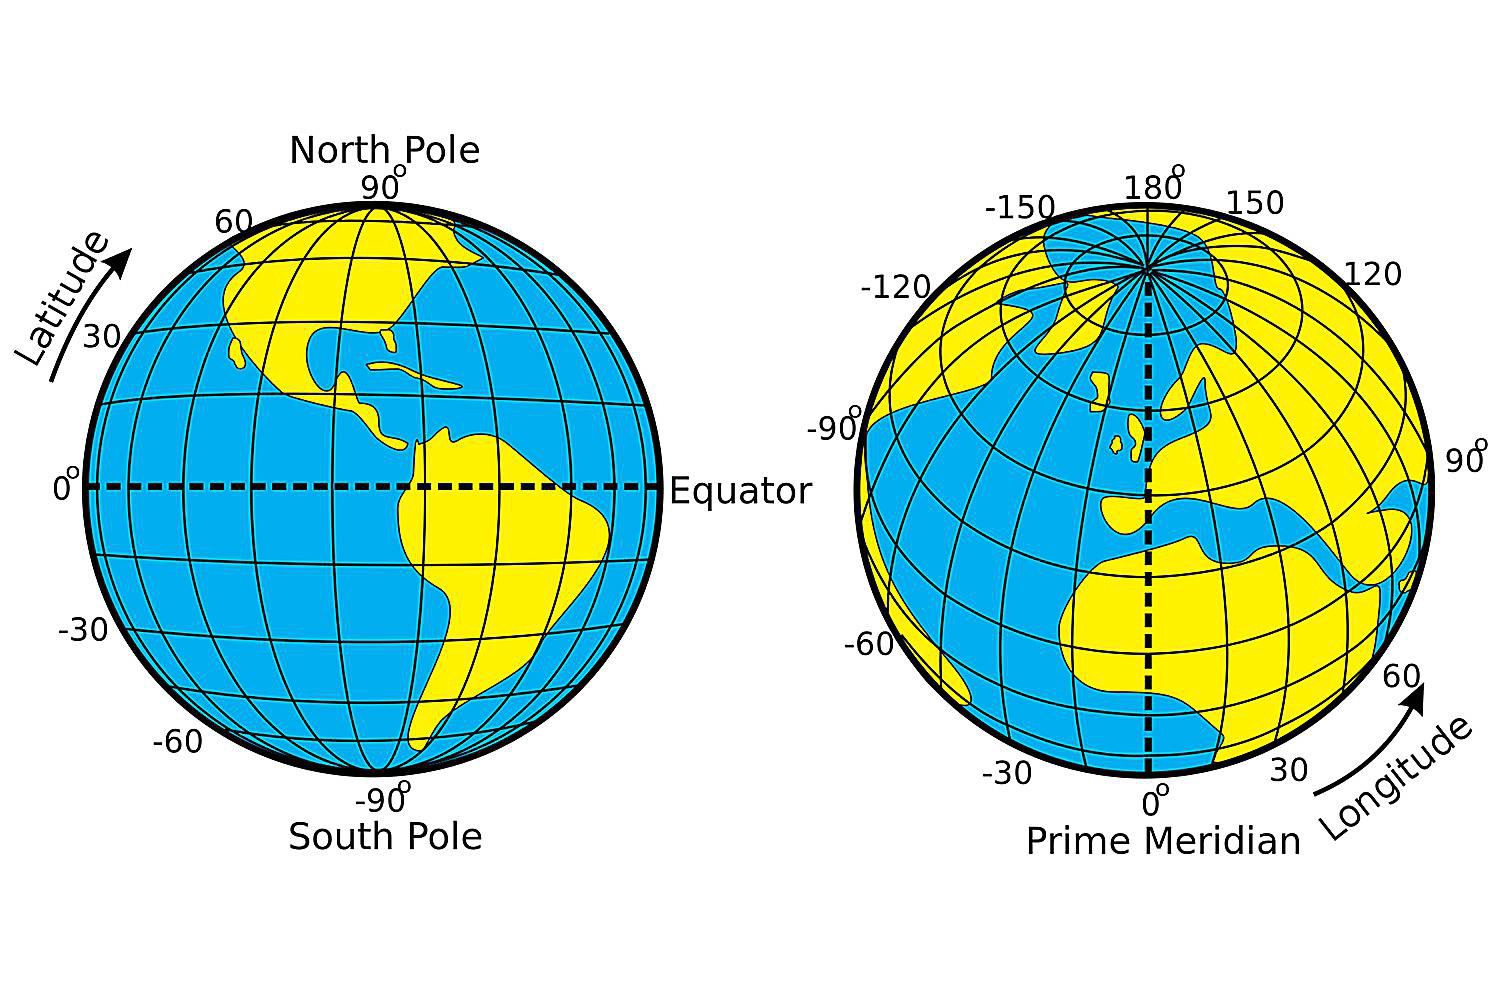
So what I mean by that is that the units of longitude are at their largest (physical distance wise) at the equator and effectively approach zero distance between longitude lines at the poles.
This is easily seen in the cartoon on the right.
Which means the more North/South you go, the faster the changes in longitude are as you move along a latitude.
i.e. at the North pole you can cover all longitudes with your hand, where at the equator you would have to walk around the entire planet to cover every longitude.
So what that means in practical terms is at the equator I could do this Cartesian approximation with out a problem.
Whereas if I were doing this near one of the poles this whole thing would be a nightmare and I am pretty sure you would want to take an entirely different approach.
So Switzerland is fairly North of the equator so we actually do see a fair amount of warping, this was fortunately pretty easily remedied however with some quick iteration.
It was found that by just applying a factor of 1.44 to the longitude we get our particles to follow the LHC path very closely.
So now we have:
Putting this all into the code we define a couple functions which generate our two trajectory lists like so:
  count = 0

  pathFunc = () => {
    let path_list = []
    for (let i = 0; i < this.iters; i++) {
      path_list.push({ lat: (this.LATcenter - this.radius*Math.cos(i*(this.step - Math.PI/2)), lng: (this.LNGcenter + this.radius*(1.44)*Math.sin(i*(this.step - Math.PI/2)) ) });
    }
    return path_list
  }
  path = this.pathFunc()

  pathFunc2 = () => {
    let path_list = []
    for (let i = 0; i < this.iters; i++) {
      path_list.push({ lat: (this.LATcenter + this.radius*Math.cos(i*(this.step - Math.PI/2))), lng: (this.LNGcenter + this.radius*(1.44)*Math.sin(i*(this.step - Math.PI/2))) });
    }
    return path_list
  }
  path2 = this.pathFunc2()
Where the seemingly random count variable at the top will be our main iterator that will move us through these trajectory lists.
The next bit of code below chronologically need not to come at this point necessarily but this is where I have it in my code, so here we are.
These next two function effectively will define the frame rate as it will call the yet-to-be-defined moveObject function every 50ms.
  componentDidMount = () => {
    this.interval = window.setInterval(this.moveObject, 50)
  }

  componentWillUnmount = () => {
    window.clearInterval(this.interval)
  }
Ok now we have our meat and potatoes moveObject bit here where a few things are going on.
  moveObject = () => {

    if (this.count === this.path.length) {this.count=0}
    if (this.count === this.path2.length) {this.count=0}
    let progress = this.path.slice(0, this.count)
    let progress2 = this.path2.slice(0, this.count)
    if (this.count <= this.iters) {this.count++}
    this.setState({ progress })
    this.setState({ progress2 })
  }


The first if statements we see are just so we don't have any out of bounds issues with the trajectory lists.
As we want to pass through the lists many times to get many revolutions.
We really only need one of these statements since we are iterating through two lists of the same size simultaneously, but for robustness, and potential future developments, we might as well throw that extra one in there.
The next two statements are a kind of contrived way of iterating through the trajectory list, which I think is necessary, but I want to believe there is a more sraight forward way of doing this.
So effectively how this works is we define two new variables with the very inspired names, `progress` and `progress2` that are updated every iteration of `count` to be the sublist of `path` and `path2` with entries from the start of the `path`/`path2` list to `count`.
Then in the next section we will see that we take the last element in each sublist (so whatever `count` is) to be the current frame (lat/long of the particles)
The next line just checks `count` against `iters`, which is just the length of the path/path2 list and then updates the count iterator.
The states are then set in the next two lines with each progress list.

Finally we can draw the Google Maps Marker objects, who's coordinates will be updated via the progrss lists.
Here I have chosen our two circulating object to be little circles as they show up batter in the animation.
Then for the color we choose red, because protons are red (not really).

```javascript
  render = () => {
    return (
      <GoogleMap
        defaultZoom={13}
        defaultCenter={{ lat: 46.224690, lng: 6.110898 }}
        >
        <Circle
          center = {{ lat: 46.272948, lng: 6.064695 }}
          radius = {4249.43698}
          options = {{
           fillOpacity: 0.0,
           strokeColor: '#0b80c3',
           strokeWeight: 2,
            }}
        />
        { this.state.progress && (
          <>
            <Marker
              position = {this.state.progress[this.state.progress.length - 1]}
              icon = {{ path: window.google.maps.SymbolPath.CIRCLE, scale: 2, strokeColor: '#FF0000' }}
            />
          </>
        )}
        { this.state.progress2 && (
          <>
            <Marker
              position = {this.state.progress2[this.state.progress2.length - 1]}
              icon = {{ path: window.google.maps.SymbolPath.CIRCLE, scale: 2, strokeColor: '#FF0000' }}
            />
          </>
        )}
      </GoogleMap>
    )
  }
We now have our circulatiing beams in our collider!
Colliding Protons

As breifly stated before, we have the protons circulating in such a way that they actually cross each other at the ATLAS and CMS experiments.
So to add collisions, and complete this little animation, let us add some event display like cartoons to signify a collision every time they cross.
To do this we first need to add a couple more states.
  state = {
    progress: [],
    progress2: [],
    ATLAS: null,
    CMS: null,
  }
To get the event displays to flash when the protons cross we will need to compute the distance between where the protons are at any given time and the positions of the detectors, and if this distance is within some threshold, niavely the global minimum, we flash the event display images for some short period of time. Taking advatage of our symmetries, the fact that the both of the oppositely circulating protons will cross at the detector points, we only need to compute the distance between one of one protons and a detector. This takes on the following form in the code below:
    const { lat: lat1, lng: lng1 } = this.path[this.count]
    const pos_ATLAS = new window.google.maps.LatLng(46.235280, 6.055462)
    const pos_CMS = new window.google.maps.LatLng(46.310080, 6.071962)
    const pos_particle = new window.google.maps.LatLng(lat1, lng1)
    const distance_ATLAS = window.google.maps.geometry.spherical.computeDistanceBetween(pos_ATLAS,pos_particle)
    const distance_CMS = window.google.maps.geometry.spherical.computeDistanceBetween(pos_CMS,pos_particle)
    if (distance_ATLAS < 100) {
      this.setState({ATLAS: Map})
      setTimeout(() => {
        this.setState({ ATLAS: null})
      }, 400)
    }
    if (distance_CMS < 250) {
      this.setState({CMS: Map})
      setTimeout(() => {
        this.setState({ CMS: null})
      }, 400)
    }
Lastly we add this to the <GoogleMap> tag with the other map objects in order to draw the event display images, which are the .svgs you see in the paths below.
{this.state.ATLAS && (
  <>
    <Marker position = {{ lat: 46.235280, lng: 6.055462 }}
      map = {this.state.ATLAS}
      icon = {{url: "/cern_lhc_icon_ATLAS.svg", scaledSize: new window.google.maps.Size(100,100), anchor: new window.google.maps.Point(45, 49)}}
    />
  </>
)}
{this.state.CMS && (
  <>
    <Marker position = {{ lat: 46.310180, lng: 6.076762 }}
      map = {this.state.CMS}
      icon = {{url: "/cern_lhc_icon_CMS.svg", scaledSize: new window.google.maps.Size(100,100), anchor: new window.google.maps.Point(45, 49)}}
    />
  </>
)}
Well that's all folks! You can view this working on my home page at the bottom and I hope you learned something about particle physics and geography. Feel free to ask any questions in the comments section below!